Overview
This project focused on creating a unified branding and data visualization system to ensure consistency across multiple departments. Teams were producing content independently without centralized creative oversight, resulting in inconsistent reports, presentations, and published materials. I led the development of a comprehensive brand and data visualization framework that improved alignment, accessibility, and governance across the organization.

Turning Data Into A Brand Experience
Organization-Wide Adoption
Rolled out the system across departments, enabling widespread adoption, improving workflow efficiency, and establishing long-term governance for all brand and visualization outputs.
Platform & Resource Implementation
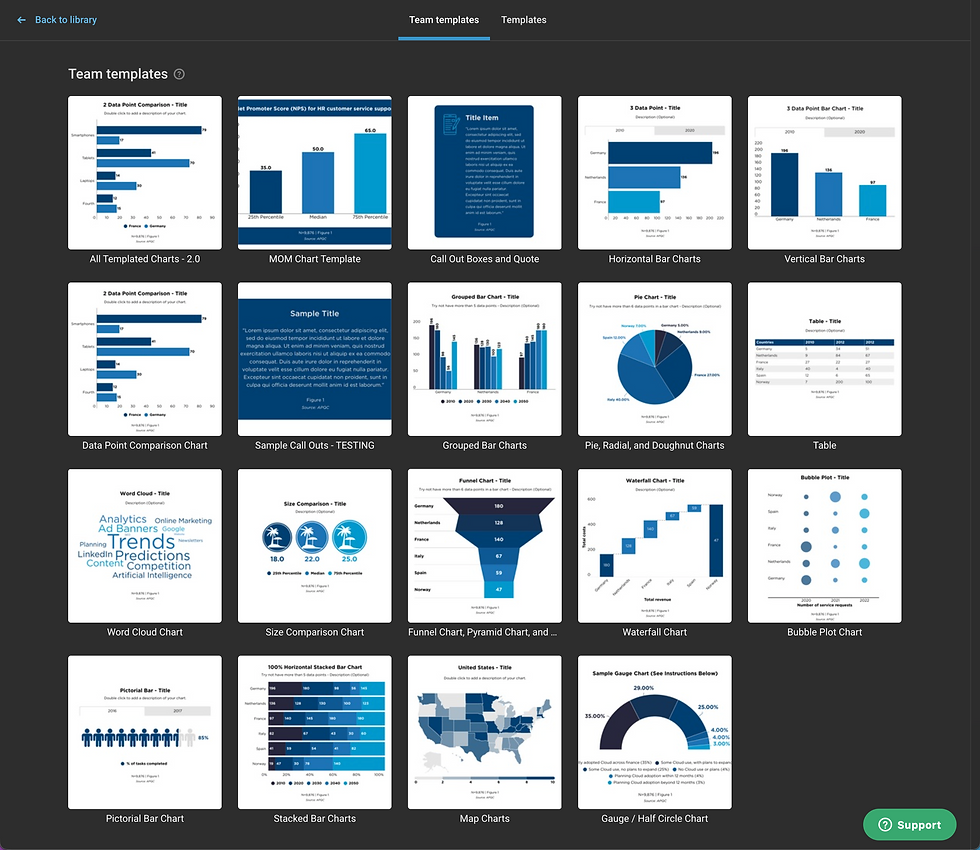
Launched a SharePoint resource hub and implemented Infogram with branded templates, providing employees with easy access to approved assets, tools, and documentation.
Brand & Visualization System Design
Developed standardized typography, color systems, chart formats, and data visualization guidelines that aligned branding with data storytelling.
Strategy & Governance Framework
Partnered with stakeholders to establish organizational goals, governance requirements, accessibility standards, and a scalable framework for consistent communication.
Audit & Discovery
Conducted a comprehensive review of reports, presentations, charts, and published content to uncover inconsistencies in branding, messaging, typography, and visualization practices across departments.